NPGS Microscope Considerations
Almost any SEM or STEM can be used with NPGS to perform e-beam lithography. The following is an alphabetical list of the microscopes that have been used with NPGS. Note that some models require optional external inputs from the manufacturer. Often, different models of microscopes from the same manufacturer will have the identical XY interface. Consequently, models that are not shown, may actually be the same as a model already in use with NPGS. Please call or send e-mail if you would like to get the complete NPGS User List which includes names, telephone/fax numbers, e-mail addresses, and microscopes being used. (The models shown below are indicated as: SEM=Scanning Electron Microscope, STEM=Scanning Transmission Electron Microscope, FE-SEM=Schottky (thermal) Field Emission SEM, and cFE-SEM=cold cathode FE-SEM.)
- Amray 1200, 1400, 1830 SEMs
- Amray 1840, 1845, 1850 FE-SEMs
- Cambridge Instruments S120, S200, S240, S250, S360 SEMs
- Camscan Series 4 SEM
- Elionix ERA-8800
- FEI XL30-W, XL30-LaB6, XL40-W SEM
- FEI XL30 FEG, XL30 SFEG FE-SEMs
- FEI XL30 ESEM FEG FE-SEM
- FEI Inspect S, Quanta SEMs
- FEI Inspect F, Quanta FEG, FEG ESEM FE-SEMs
- FEI Sirion, NanoSEM, Magellan, Teneo, Apreo, Quattro FE-SEM
- FEI Quanta 3D Dual W, Ion Beam Microscope
- FEI Strata 235/237/620/810/820 Dual FE & Ion Beam Microscope
- FEI Quanta 3D, Nova Nanolab, Helios, Scios Dual FE & Ion Beam Microscope
- Hitachi S510, S570 SEMs
- Hitachi S2460N SEM
- Hitachi S2300, S2400, S2500 Delta, S2700 SEMs
- Hitachi S3000H, S3000N, S3400, S3500N SEMs
- Hitachi S4000, S4100, S4200, S4500, S4700, S4800 cFE-SEMs
- Hitachi S4300SE FE-SEM
- Hitachi SU1510, SU3500, SU3800 SEM
- Hitachi SU6600, SU70, SU5000 FE-SEMs
- Hitachi HD2700 STEM
- Hitachi FB2000A FIB
- Ionoptika Custom FIB
- ISI 60 SEM
- JEOL 1200EX STEM
- JEOL 820, 840, 845, 848 SEMs
- JEOL 5400, 5600, 5800, 5900, 5910, 6360, 6460 , 6380, 6480, 6390, 6490, 5700, 6010, 6510, 6610 (also LV versions) SEMs
- JEOL IT100, IT200, IT300, IT500 , IT500HR SEMs
- JEOL 6100, 6300, 6400, 6600 SEMs
- JEOL 840F, 6300F, 6340F, 6400F, 7401F, 7500F cFE-SEMs
- JEOL 6500F, 7000F, 7001F, 7100F, 7200F, 7600F, 7800F, 7900F, F100, IT800 FE-SEMs
- JEOL 4501
- Leica S440 SEM
- LEO S430, S438, S440 SEMs
- LEO 1430, 1430VP SEMs
- LEO 982, 1525, 1530, 1550 (also VP versions) FE-SEMs
- Philips 501 SEM
- Philips EM420 STEM
- Philips CM-20 STEM
- Philips XL-20, XL-30 SEMs
- STS SEMView8000
- Tescan Vega SEM
- Tescan Mira FE-SEM
- Tescan Lyra Dual FE & Ion Beam Microscope
- Thermo Fisher Scientific Apreo
- Thermo Fisher Scientific Helios, Scios Dual FE & Ion Beam Microscope
- Topcon SM 350 SEM
- Zeiss 940A, 960A SEM
- Zeiss EVO SEM
- Zeiss Orion He Ion Microscope
- Zeiss/LEO Supra, Ultra, Sigma, Merlin, GeminiSEM (also VP versions) FE-SEMs
- Zeiss/LEO Auriga, Neon, Crossbeam 1540 Dual FE & Ion Beam Microscope
Notes: Cambridge Instruments became Leica, which merged with Zeiss to become LEO, which has now changed to Carl Zeiss - Nano Technology Systems; Philips became FEI, which became Thermo Fisher Scientific (TFS).
The following is an overview of the considerations that are important when choosing a microscope to be used for lithography. (Also see the summary of microscope features that are useful for lithography on the "Questions and Answers" page.)
- Overall Performance- The research or analytical level of microscopes tend to perform the best for lithography, while the low-cost, entry level microscopes tend to have more problems. Often an older, high performance microscope will work better for lithography than a new low-cost model.
- Beam Current Stability - Requirements depend on pattern linewidths and total exposure time. Pattern exposure times may range from seconds to hours. Tungsten and LaB6 filaments have performed very well, while cold cathode field emission (cFE) filaments tend to drift significantly and have significant noise. When considering a cFE SEM for lithography, getting a graph of the beam current vs. time will be very helpful in evaluating the potential problems it may impose on lithography. NPGS users with cFE SEMs have reported at least +/-3% noise and typically +/-15% drift per hour, and in some cases random +/-10% jumps and/or drifts of 20% in 20 minutes have been observed. In contrast, thermal FE sources are very stable and have low noise. For example, measurements taken in one NPGS user's lab of the beam current from a thermal FE source over a 12 hour period showed a max to min variation of less than 1 pA, while the average value was 129.5 pA. This was less than 0.1% per hour drift . About 97% of the readings (which were taken every 5 seconds) showed no noise (to the 0.1 pA resolution of the meter) and the remaining 3% of the readings had values within 0.4 pA of the local average. Such stability is ideal for SEM lithography. In contrast, a cold cathode FE SEM will often have continuous noise spikes/jumps on the order of +/- 3%, less frequent random jumps on the order of +/- 10%, and drifting on the order of 10% per hour. The best approach that is known to reduce the instability of a cFE SEM is to frequently bake the gun.
- Maximum Beam Current - Tungsten and LaB6 filaments provide more than enough beam current for most SEM lithography applications. Older thermal FE sources provide much less beam current than conventional sources, however, the maximum should be adequate for almost all SEM lithography. Note that some of the newer thermal FE SEM models can provide high beam currents (>100 nA). Cold cathode FE sources provide even less beam current than thermal FE sources, which may impose a limit when trying to write very large structures quickly by using a large beam current. All sources provide adequate current for writing fine structures.
- Resolution - The ultimate resolution of the microscope is not the most important concern for lithography, although a high attainable resolution usually indicates a high performance microscope. Being able to consistently minimize the astigmatism is the more important issue for most lithography.
- Accelerating Voltage - In general, a higher beam voltage produces smaller linewidths. However, by using multilayer resists, surprisingly high resolution lithography can be done at relatively low (<15 kV) beam energies. Older high performance SEMs will often go to 40 kV, while new SEMs typically have a 30 kV maximum voltage. At the same kV, a field emission SEM will typically produce finer lines than a conventional SEM.
- Magnification - Any microscope magnification may be used for pattern writing. The magnification will determine the patterning field of view and the minimum linewidth. Typically, fine patterns (< 0.1 um) will be written at a magnification that gives a field of view of approximately 100 um square. Also, the writing field center will often be offset as the microscope magnification is changed. NOTE: Any magnification value is the ratio of the size of the displayed image to the size of the area being viewed. Historically, all magnification values were displayed relative to a Polaroid, since that was the only output device of most electron microscopes. However, on many newer microscopes, the microscope software will allow the magnification to be displayed relative to a Polaroid, a VideoPrinter, or the PC Display, consequently, different magnification values will be displayed for the same sample area, depending on the mode of the microscope software. In summary, "magnification" is not the nearly universal number as it once was and any comparisons must account for the mode of the microscope when the value was displayed. However, many people still talk about magnification values as though all microscopes still use the Polaroid as a universal reference size. The difference in the magnification value displayed in the different modes may range from ~5% to ~300%. For example, a 1,000,000x image on a microscope in the Display mode with a 21" screen may be about 300,000x when in Polaroid mode, even though the image itself is identical in both cases.
- Magnification Transition Values - Every SEM will have special transition values when changing the magnification which select different amplification circuits within the microscope. When imaging, an audible 'click' is often heard and sometimes a momentary 'glitch' is seen on the display, but no significant change is typically observed when crossing one of these transition values. However, for lithography, the signal-to-noise within the microscope will typically be noticeably worse as seen in patterns written when the magnification is just below a transition value as compared to just above the transition value. For the best lithography, these transition values, which often depend both on the accelerating voltage and working distance, should be identified and the magnification values used for pattern writing be selected accordingly. The NPGS Manual gives typical transition values for many SEM models and provides additional information on determining the optimum magnifications for pattern writing for any microscope. (Note: These transition values are a completely separate issue from the magnification modes discussed below.)
- Magnification Modes - Most SEMs will have a single magnification mode which ranges from the lowest possible to the highest possible setting. This single magnification mode is good for lithography, since the optimization used for high resolution writing is preserved when changing to a lower magnification for larger structures. However, some field emission SEM models from Hitachi and JEOL have separate high and low magnification modes where the ranges of the two modes overlap around a field size of 100x100 um2 such that larger writing fields required the low mag mode and smaller fields require the high mag mode. Once the high or low mag mode is set on the microscope, the only way to reach the field sizes of the other mode is for the microscope to make substantial changes to the electron optics. This is typically done by a simple mouse click in the SEM software, however, changing back and forth will degrade the optimization of the SEM. The nuisance is that many lithography applications require fine features to be written in the high mag mode and also large features to be written in the low mag mode, where the SEM optimization is degraded when switching between the modes. This does not prevent the SEM from being used for lithography, but it is a negative issue for some applications.
- Stage Stability - Basic concerns are backlash and drift. Fine Z motion is also useful for focusing. If you already have the microscope, it is very easy to characterize the stage stability simply by going to a high magnification, moving the stage, and measuring the drift versus time. For a given application, the requirement depends on the feature size and the writing time. For example, if a pattern consisting of 0.1 um lines takes 1 minute to write, a stage drift of 20 nm/minute would probably be acceptable. When a stage has a significant drift problem, designing the pattern to write the features requiring careful alignment first can minimize the problem.
- Electronic Scan Rotation - This is useful for aligning the writing axes to the sample and/or stage motion, however, on some SEM models the scan rotation circuit will introduce distortions which make it unsuitable for use with lithography.
- Magnetic Shielding - Magnetic shielding may be necessary depending on the microscope environment. Typically, if no external interference is observable when the microscope is used for viewing, then pattern writing should also be unaffected.
- Faraday Cup - A picoammeter is essential for measuring the beam current before exposures. Ideally, a Faraday cup will be inserted into the column or directly above the sample without requiring the sample to be moved, or it will be mounted on the sample holder. If the Faraday cup is on the stage, the picoammeter can usually be connected to a "specimen current output" on the SEM. Normally, the specimen current output will either have a grounding cap which simply keeps the sample at ground potential or it will be connected to an alarm circuit which indicates if the sample/stage has touched anything in the chamber.
- Beam Blanker - A magnetic or electrostatic beam blanker is suggested, although one is not required. Using only a slow beam shutter or no blanker at all is sufficient for many applications. See the "Questions & Answers" page for more information about doing lithography without a blanker. When considering a new microscope it makes sense to purchase a blanker with the microscope. Be sure to check that the blanker will have electronics that will accept a standard TTL (or comparable) input and not require a low noise input. Also, a blanker should be expected to work over the full operating range of the SEM (i.e., from high current to low current, and from high kV to low kV, etc.) with no degradation of imaging or blanker performance, unless otherwise noted by the seller. Be advised that in general, most SEMs are not sold with blankers and the SEM salespeople are often unfamiliar with the details of the blanker that their company offers. Note that some blankers with a "Faraday cup" feature do not give a true reading of the beam that hits the sample!
- X&Y External Control - The beam position must be controllable by an external voltage. Most microscopes have an External Beam Interface which is either built-in or available as an option (see Requirements below). If the interface is already used by an x-ray or digital imaging system, a manual switch or relay box will be required.
- Image Signal Output - An image signal must be available for precision alignment. If the scope does not have a processed output signal, the amplified PMT output can be used (see Requirements below).
- Digital Interface - Typically, the column parameters for a digital microscopes can be controlled during pattern writing through a serial or Ethernet port. Free software drivers are available with NPGS for microscopes from Hitachi, JEOL, Zeiss/LEO/Leica, Tescan, and FEI/Philips. (Please check on specific models.) The most useful commands through a microscope's digital interface control the magnification (or FOV), focus (=WD), spot size (=condenser lens setting or sometimes an aperture size), degauss (=lens clear or hysteresis removal), x stigmator, and y stigmator. Usually, the same digital interface is also used to control the XY stage position.
- Automated Stage - Stages that can be controlled by an external computer may be used to automatically move the sample during pattern writing. Free software drivers are available with NPGS for stages from Deben Research, Hitachi, JEOL, Zeiss/LEO/Leica, FEI/Philips, Kleindiek. (Please check on specific models.)
- Other Microscope Accessories - While accessories such as EDS and WDS are normally not used during lithography, there are lithography applications that involve gas injection systems (GIS). A free software driver is available with NPGS for the OmniProbe GIS.
- Requirements - The microscope must have XY scan control inputs with a range between +/- 3 and +/- 10 volts with input impedance greater than 2k ohms. Also required is access to an image intensity signal within +/-10 volts. A picoammeter is also required for lithography.
- Limitations - Typically, microscope limitations are most pronounced when using a large (> 500 micron) field of view. The limitations include nonlinearity of the scan coils and position dependent focus and astigmatism effects. SEM lithography is a demanding application and limitations can be observed in any commercial electron microscope. Typically, linewidths on the order of 0.2 micron can be written over a field of 500 microns, while the finest lines (<0.03 microns) can be written in a field of about 100 microns. Large structures can be written at the largest field of the microscope, which is usually about 10 mm. Results will vary depending on the microscope in use.
Where appropriate, expected, typical, or preferred responses are shown below in [ ]'s. While NPGS can be used with the most basic of manual SEMs, it also has very advanced features that make use of automated stages and the serial interface to a digital SEM. The items below should cover the most advanced use of the SEM for lithography.
-
XY Inputs (required)
-Voltage range for full deflection (x & y)? [+/-10v to +/-5v]
-Input impedance (x & y)? [>2k ohms]
-Connector type? [BNC]
-External scan enabled by software or electrical connection? [either is OK]
-Are multiple xy inputs available if NPGS and x-ray system are to be used? [if not, a special input adapter may will needed if an x-ray mapping system is present]
-Does internal scan generator turn off when SEM is in external mode? [often no, preferably yes] -
Image Signal Output (required)
-Maximum voltage range? [< +/-10v]
-Typical voltage range for black to white image change? [> .3 volts]
-Connector type? [BNC]
-Signal available when SEM is in external mode? [yes] -
Picoammeter (required)
-Picoammeter available integrated with SEM? [typically no]
-If yes, can it be activated and read through SEM serial interface in pA or Amps?
-If no, can Keithley 485, 486, or 6485 be connected to Faraday cup on stage? [yes]
-Connector type for specimen current reading? [BNC or Triax] (This allows a picoammeter to read the beam current collected by a Faraday cup mounted on the sample holder. Often, an alarm circuit that indicates if the sample has hit the final lens assembly will need to be disconnected in order to read the beam current from the sample holder.) -
Blanker (optional)
-Typical rise/fall/delay times? [< 1 usec each]
-Maximum repetition rate? [>100 kHz]
-Voltage input (on/off values)? [within +/-5 volts]
-Input impedance? [>50 ohms]
-Input noise threshold? [should not require low noise input]
-Connector type? [BNC] -
Stage/Sample Holder
-Allows gold resolution standard, Faraday cup, and sample to be mounted simultaneously? [yes] -
Automated Stage (optional)
-Serial or Ethernet interface to read and set (x,y) positions? [yes]
-Resolution for reading/setting through serial interface? [1 um or better]
-Accuracy? [typical OEM stages are accurate to 1 to 5 um]
-Backlash correction available? [yes] -
SEM Interface for Remote Control (optional)
-Interface protocol? [RS232 serial or Ethernet]
-Can read and set fine focus (or working distance) to the same resolution as through SEM User Interface? [yes]
-Can read and set magnification? [yes]
-Typical image image shift when changing between magnifications? [<5 um for large mag changes]
-Can set probe current to user defined value (e.g. 10.0 pA)? [typically no]
-Can set fine probe current value (arbitrary units)? [typically yes, allows indirect setting of current to a specific value, e.g. 10.0 pA]
-If no, can set coarse probe current (or spot size/aperture setting)?
-Can fine/coarse probe current be changed without losing beam optimization? [fine is typically OK, coarse will usually introduce astigmatism]
-Can access all SEM User Interface commands through serial interface? [list any exceptions; however the typical parameters changed during lithography are addressed above] -
Other SEM Parameters/Considerations
-Minimum magnification when in external mode? [100x or less]
-Drift in probe current? [W is ~1%/hour, LaB6 is ~3%/hour, thermal FE is <<1%/hour, cold cathode FE is ~10%/hour or worse]
-Noise in probe current? [W, LaB6, & thermal FE ~1% or less, cold cathode is ~ +/-3% or worse]
-Minimum/Maximum probe currents available? [5 pA to 1 nA]
-Maximum accelerating voltage (kV)? [30 or higher]
-Stability of SEM at maximum voltage (hours)? [3 hours or more]
-Digital image storage to PC formats available/standard? [to floppy, ZIP, or CD in TIFF, GIF, or JPEG]
-Stage drift (nm/minute)? [<10 nm/min after 4 minutes]
-Stage settling time required after movement to meet drift specification (seconds)?
-Manual fine Z control of stage available? ["fine" means good enough to use for focusing at 20,000x]
-Electronic scan rotation available/standard? [must rotate scan when in external mode without distorting image]
- Microscope Setup - Don't be afraid of the microscope! If you are in charge of running the microscope, you should be very familiar with its setup and operation. Don't simply trust that the microscope will always be in good shape if it is under a service contract. Many times when I have inspected newly purchased microscopes that were professionally installed by the various vendors (and often signed off and paid for), I have found that essential components were installed improperly, incompletely, or just didn't function, or the microscope had completely unexpected and inexcusable problems, such as shipping bolts that had not been removed or cables that were connected incorrectly. Often, a simple visual inspection of the microscope will find problems such as loose wires or bolts that have been dropped where they don't belong. Touching the column can identify vibration problems or thermal problems with coils. You should touch any cables (just avoid any exposed electrical connections) or hoses that lead to the microscope column to check for "vibration leaks", for example, stiff water lines from a chiller can very efficiently transfer vibrations directly to the column. Also, gently pushing on the column should make it rock back and forth. If not, the vibration isolation of the column should be checked (this was all that was necessary to discover that the internal shipping bolts had not been removed during the 'professional' installation of a new FE SEM, even before seeing the terrible imaging). If the microscope is on a third party vibration isolation support structure, be sure that all the support columns are actually floating (two out of three support structures that I have inspect have been malfunctioning). Typically, the issues that are discovered in such an inspection will not prevent the microscope from running, however, they very well may prevent the microscope from running at its ultimate performance level, which is what you want for lithography.
- Room Environment - In many cases, the microscope itself will be performing as well as it can, however, the room environment (vibration, acoustic noise, magnetic fields) can degrade the observed performance. For a discussion on typical concerns, see the online paper: "Site Selection Considerations For Scanning and Transmission Electron Microscopes" by Wayne Vogen, Vibration Engineering Consultants, Inc. See the NPGS page on line frequency interference, which also lists a source for an inexpensive gauss meter, which can be extremely useful for locating sources of magnetic fields. While imaging at high magnification, simple tests such as stomping your foot, clapping, or even talking can illustrate the sensitivity of your microscope to external vibrations and acoustic noise.
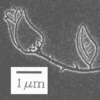
- Image Resolution - Take a picture of a gold resolution standard (typically gold islands on a carbon substrate) at the highest accelerating voltage (typically 30 or 40 kV), at ~10 pA, and with a field size of about 1 micron. Use the smallest aperture to get the best resolution. Look for line frequency noise (broad bands of distortion), vibration (choppy distortion along vertical edges), and overall image sharpness. Line frequency noise from the environment will be worse when using lower kV or longer working distances. Comparing to an image from a higher performance SEM or the gold standard images on the NPGS web site can be helpful.
- Focus Stability - The long term stability of the SEM focus can be checked by doing the following: After focusing on a gold standard, either blank the beam or move the sample to another area a large distance away and wait for 10 minutes. Then, return to the original area to check if the sample is still in focus. For a thorough check, this can be repeated over a period of 1 to 2 hours.
- Beam Current Stability - Connect a picoammeter to a Faraday cup in the SEM and monitor the beam current from the initial SEM startup until the value stabilizes. Typically, an SEM will take 1/2 to 2 hours to stabilize to ~1% drift per hour for a W filament, 2% to 3% drift per hour for LaB6, <1% drift per hour for a Schottky (thermal) FE SEM, or +/-5% to +/-30% of drift and random jumps for a cold cathode FE SEM. Look for unusual spikes or abrupt changes in the beam current, which should not be present other than with a cold cathode FE SEM. (However, there is evidence that frequent baking of a Hitachi cFE SEM can greatly reduce the beam instability.)
-
Optimum Magnification for Pattern Writing - The typical SEM will have
different circuit elements for different ranges of magnifications and the
low end of each range will provide the best signal to noise for pattern
writing. The signal to noise may change by an order of magnitude
or more when when changing from the magnification at the top of one range
(worst) to the bottom of the next (best). (The signal to noise also
changes when imaging, however, the resolution of images is typically too
low to directly observe the degraded performance, however, the difference
can be dramatic for lithography.) To find the changes in the magnification
ranges, do the following.
- Optimize the SEM for the conditions to be used for lithography, such as kV, beam current, and working distance, and change to the lowest possible magnification.
- Steadily increase the magnification and watch for any 'glitch' in the image or offset in the image position (when above ~20,000x) as the magnification is changed. Also, listen for any audible 'click' which may result when mechanical relays change from one range to another. Note that lithography is typically performed with a field size of ~20 microns or larger (up to the maximum possible field size), so any range changes that occur at magnification values with smaller fields do not really affect lithography, but can be useful to check while characterizing the microscope.
- For analog SEMs, the changes will typically occur at fixed intervals such as 100x, 1000x, 10,000x, or 250x, 2500x, 25,000x, while for many new PC based SEMs (from FEI and LEO) the range changes will depend on both the kV and working distance being used and even on if the magnification is being increased or decreased (from FEI).
- Note that for PC based SEMs, the displayed magnification number may refer to different output dimensions, such as for a Polaroid output, the screen display, or a videoprinter printout. When the displayed SEM magnification is calibrated for a videoprinter, the values will be similar to a Polaroid calibration (since the two output images are nearly the same size), but when it is calibrated for the SEM display, the magnification value will typically be about 2 to 2.5 times higher (since the typical screen display size is about 2 to 2.5 times larger than a Polaroid image).
-
Beam Blanker Response - To be thorough, the blanker should be tested
at low and high beam currents, at low and high accelerating voltages, and
at low and high magnifications.
- A simple two step test is to put the beam into a Faraday cup on the sample holder and measure the steady-state beam current and then to measure the beam while it is being dynamically blanked with a 50% duty cycle. The 50% duty cycle should produce a beam current reading that is exactly 50% of the steady state reading. The measured ratio can be checked at different duty cycles and/or different blanking frequencies.
- The image itself can also be used to diagnose the blanker. While the beam is being dynamically blanked, the image should not shift or degrade (other than the black stripes caused by the blanking). To make the test the most sensitive, look at a gold resolution standard while at high magnification so that you can look for small changes in focus and astigmatism that may be induced by the blanker. You may need to adjust the blanking frequency and/or the scan rate to obtain black stripes on the screen that are relatively steady. When using a digital SEM, turn off any averaging of the display image.
- Obtain an image of a high contrast structure and then change the SEM to line scan mode. In this mode, a single line will be scanned and the vertical displacement of the trace on the SEM display will represent the brightness of the structure being scanned, much like an oscilloscope display. While observing the line scan mode, blank the beam with the blanker to see of the entire line scan trace changes to a flat line. If any structure is seen when the beam is blanked, it indicates that some beam is still hitting the sample, i.e., the blanker is not blanking completely. To increase the sensitivity of this test, adjust the brightness and contrast of the SEM so that the blanked signal is at the bottom of the SEM display and the bright image display is maximized. Ideally, the blanking ratio for the focused beam will be 1:1,000,000 or more. (In other words, if it takes "X" microseconds to expose a small dot with the beam on, it will take over "X" seconds to expose the same dot with the beam blanked.)
- Check if the settings of the gun tilt/shift or the adjustable aperture affect the performance of the blanker. If so, be sure that the optimum settings for blanking are the same as the optimum settings for imaging.
- By using a dual trace oscilloscope to monitor the input signal to the blanker (produced by a function generator) and an image output signal from the SEM (often labeled Video Out), the response of the blanker can be measured. Slow gun coil blankers will have a response time of 1 to 10 milliseconds, while a fast blanker will have a response time of 1 microsecond or less. If a blanker is consistently in the "on" state for less time than indicated by the input signal, a compensation for lithography can be made in the Pg.sys file (this typically only applies to ~1MHz magnetic blankers). A 50 kHz blanking signal is a good frequency to start with for a fast blanker. Note that the beam should either be stationary or be scanning a featureless area of a sample, so that there are no changes in the SEM output signal due to sample structure. Also, note that the response time of the image output signal may be slower than the blanker response for fast electrostatic blankers, so seeing rise/fall times of ~0.2 microseconds is not a cause for alarm. Unusual behavior while the beam is being dynamically blanked (i.e., pulsed by a function generator) includes a sloped response on the output signal when the beam is on and/or a delay which varies with beam current or accelerating voltage. The steady state "beam on" condition will produce a steady (but noisy) trace on the oscilloscope screen and the steady state "beam off" condition will produce a different trace on the oscilloscope screen (typically a relatively low noise signal at a lower voltage than the beam on case). Ideally, when the beam is dynamically blanked, the oscilloscope trace will cleanly jump from the "beam on" signal to the "beam off" signal.
- Unfortunately, the blanker tests listed above cannot guarantee that a blanker will perform flawlessly for all lithography. However, these tests are relatively simple and are very quick, so they are extremely helpful for finding obvious problems with a blanker, while sometimes more subtle problems will only be observable by writing patterns with fine lines. However, if a problem is observed in the tests described above, it is then much easier to resolve the problem, than the case when an entire lithography processing cycle is involved.
- Scan Rotation - Scan rotation is a very handy feature to have during lithography, since it allows the scan field to be rotated without moving the sample. However, on old SEMs the scan rotation knob my introduce a significant amount of noise into the XY signal. This can be observed if the image motion is "jerky" as the knob is changed. Such behavior may indicate that the scan rotation potentiometer is oxidized. If the pot cannot be easily accessed for cleaning or replacement, quickly turning the knob back and forth many times may rub off the oxidation and significantly improve the performance (the same technique can apply to old stereos where the volume knob introduces static or causes random jumps in the volume). For new digital SEMs, it has been observed that they often introduce up to ~3% distortion to the image XY scaling. While this size distortion will appear in the pattern writing (unless the NPGS alignment feature is used to scale the pattern to registration marks), it is typically small enough that the convenience of using the scan rotation outweighs the aspect ratio problem.
-
Stage Backlash & Stability - While imaging at high magnification,
find a small unique feature on the sample and use this to check the backlash
as the stage controls are move back and forth. A good stage may have backlash
on the order of a micron, while in a bad case, the backlash may be as much
as 30 microns or more. An automated stage controller using stepper motors
attached to the existing stage controls can minimize backlash. Stage stability
can be measured by moving the stage so that the unique feature is centered
on the screen and then measuring how far it moves as a function of time.
Generally, stage drift is not a significant concern during lithography, unless
careful registration between different parts of the pattern is a high priority.
In this case, careful ordering of the pattern elements can minimize the effect
of stage drift. Note that a steady drift in the image can be the result of
either the stage moving or changes in the electron optics. High performance
SEMs typically have an acceptably small drift, while entry level SEMs may
have a very noticeable drift. Tests that can be done are:
- At high magnification (a field size of 1 micron or smaller), locate a small, bright bit of something on the sample. Move the stage away and then back so that the selected structure is nominally centered on the screen. Watch how much the structure moves following the move. Movement that is initially fast but then slows may be settling of the stage, which may last from seconds to minutes. Long term drifting in one direction may be caused by thermal changes of the microscope column, especially if it has not been operating long (>30 to 60 minutes). Sudden changes where the image moves and then returns may be caused by changes in the local magnetic field, which may be caused by any large metal structures moving nearby, such as steel doors or elevators.
- If the stage is automated, center the image on an easily identifiable feature (with an imaging field size of ~10 microns), then make a series of automated stage moves away and back to the same location. This will give you an idea of the reproducibility of the automated stage moves. Start with simple "over and back" motion, and then try more complicated sequences which return to the same location. A good stage will give sub-micron positioning accuracy for a single over and back move and 1 to 2 micron positioning accuracy for multi-step sequences.
- If the stage is automated and you have a sample with features of a known size or displacement (be careful, since some optically defined lithography patterns may have significant size or positioning errors), program the stage to move the known distance and compare to the locations on the sample. This checks the absolute accuracy of the stage moves.
- Check the backlash of the stage, where backlash is the determined by the positioning error that results from moving the XY knobs or motors in one direction versus the opposite direction. For automated stages, there may be a backlash correction feature that can be disabled. If so, repeat the automated stage tests described above with the feature on and off.
- Stage Automation - Most older SEMs have only a manual stage, while most newer models have an automated stage integrated with the SEM controls. However, some models have a motorized stage that cannot be automated, i.e., there is no interface for external control of the motorized stage. Most manual stages can be automated through the use of third party stage controllers. Note that while NPGS can be interfaced to any automated stage, a manual stage is sufficient for many lithography applications. Drivers for NPGS to control most common automated stages from FEI, LEO, JEOL, Hitachi, Amray, Deben, and Burleigh are provided at no charge; please check on specific models.
- Line Frequency Noise - The most common problem with any SEM used for lithography is line frequency noise from the local environment. When present, the noise can almost always be seen in the imaging at high magnification, however, to the untrained eye the distortion from the noise can be difficult to identify. Another way to observe such noise is to put the SEM into a "Spot Mode" with the beam hitting an area where the sample image rapidly changes from bright to dark. If the beam is oscillating on the sample due to line frequency pickup, the image output signal will display a line frequency oscillation when viewed on an oscilloscope. Rotate the sample to check for beam movement in different directions. If line frequency noise is observed, additional information can be found at "Solutions to Problems: Pattern Noise from Environment". It may also be useful to do this "Spot Mode" test with the beam hitting a completely uniform area. In this case, any oscillation seen in the image output signal will not be from movement of the beam, but rather from noise pickup in the imaging circuitry, or possibly variations in the beam current itself.
- XY Inputs - The SEM must have XY inputs if it is to be used for lithography. Check the SEM documentation and find the XY input connector(s). There will also be some method to select the external inputs for beam control instead of the default internal scan generator. Often, this is an input which is switched between 0v and 5v or between an open and closed connection. By connecting a voltage supply to the XY inputs and enabling them, you will often be able to see the beam move on the CRT in response to the voltage supplied. For an analog SEM, before enabling the XY inputs, turn down the CRT and/or SEM brightness to avoid burning the CRT screen. On SEMs with digital image display, the CRT will typically not display the spot in external mode. In this case, the image output signal on the SEM can be monitored while changing the XY voltages to move the beam from a dark region to a bright region on the sample. The change in the image signal should confirm that the beam is actually moving. If the SEM has or has had an x-ray mapping system or an active digital imaging system attached, then it must also have XY inputs for beam control, although if there is only a single XY input, an input relay adapter will be necessary to simultaneously connect NPGS and the other accessory.